Less Vibes, More Traces
By Alex Streed •
This week I got to spend a good chunk of time working with Nate on an MCP server for Prefect. Nate had already written a bunch of functionality for the server and we wanted to prove that giving an agent MCP access actually improves diagnosing tricky Prefect issues. So we built some really cool evals using pydantic-ai (check out Nate’s dev log entry for more info on our eval approach). Sometimes they would pass, sometimes they would fail, but it wasn’t clear why.
The problem was that we would only get the final output from our eval agent. Debugging agent behavior with only final output is like trying to reconstruct a crime scene from a single footprint. We really wanted to know which tools our eval agents were calling and what parameters they were passing to know if we were exposing our tools optimally.
Since we were using pydantic-ai for our evals, we decided to give Logfire a try since both tools are made by the same team.
Instrumentation was super easy. All we had to do was add this to our conftest.py:
1import logfire
2
3logfire.configure()
4logfire.instrument_pydantic_ai()
and we could see every tool call, the parameters passed, and the token/latency cost of each step. Instead of guessing, we were swimming in data.
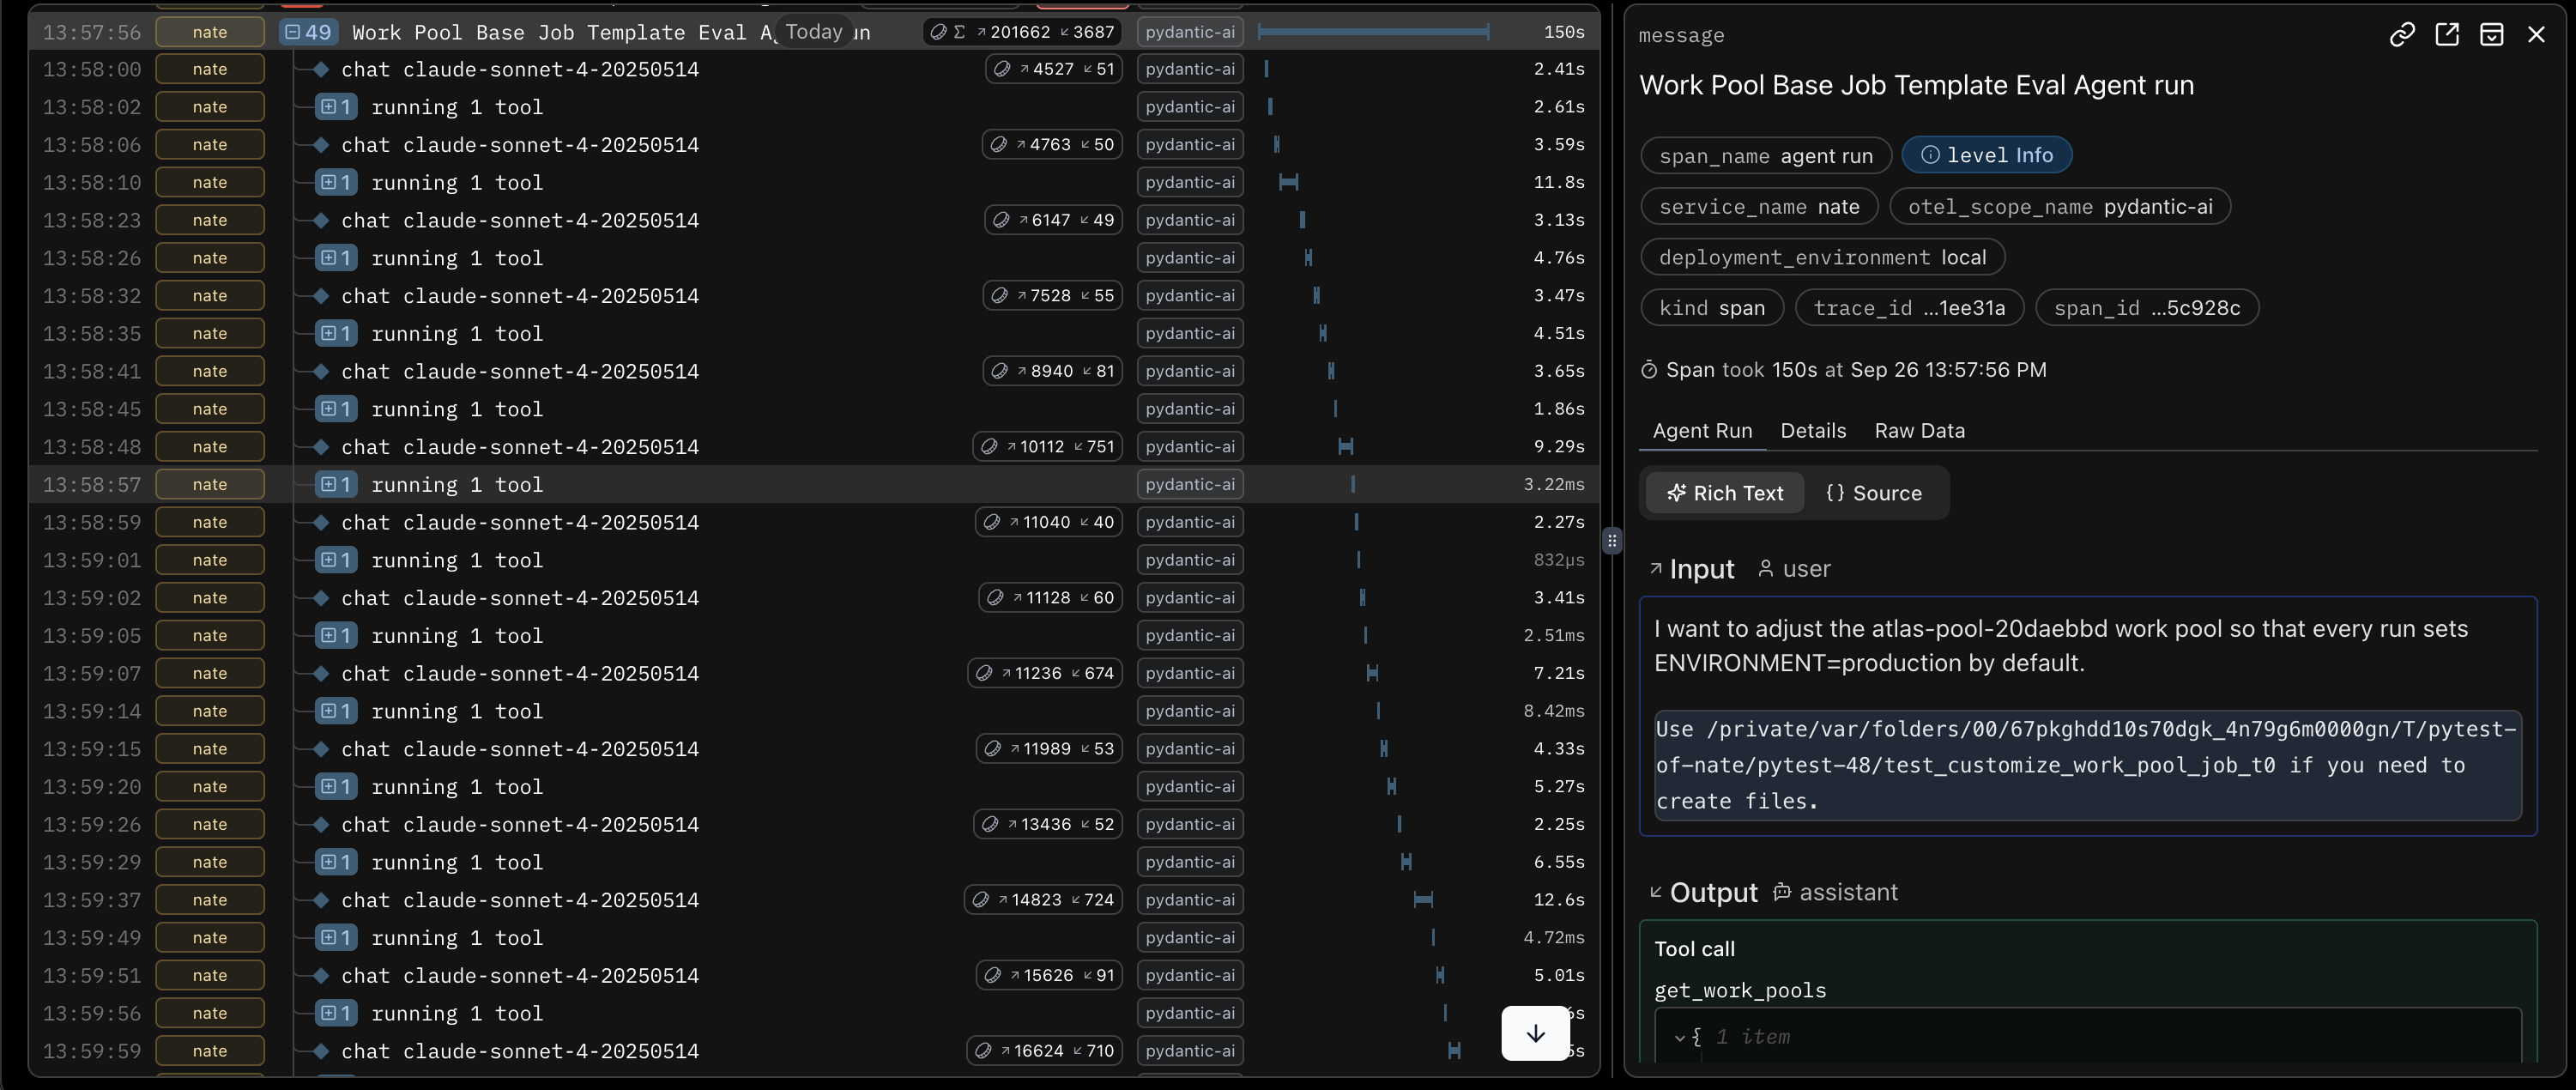
Some of the data we were swimming in
With Logfire, I could see that my idea of adding stricter type annotations to our tool schemas was quantitatively expensive because it ate up tokens like nobody’s business. It’s never been so fun to be wrong.
When we first wired up Logfire, we were all excitedly running evals and staring at the Logfire dashboard. That muddied the waters a bit because we weren’t quite sure which “Eval Agent run” was the one we each cared about. Fortunately, we used Logfire’s environment, service, and version identifiers to filter by env/service/version so each of us can isolate a single run quickly.
But things really got cooking when we hooked Logfire up with CI. Via a custom GitHub Actions workflow, each of our PRs gets a comment with a link to a Logfire view filtered to that run via the aforementioned env/service/version filters. Click the link and you’ll see the execution trace—what tools were called, what parameters were used, and where the agent made expensive choices. Seeing exactly what happened is great since these runs are non-deterministic and not guaranteed to be reproducible.
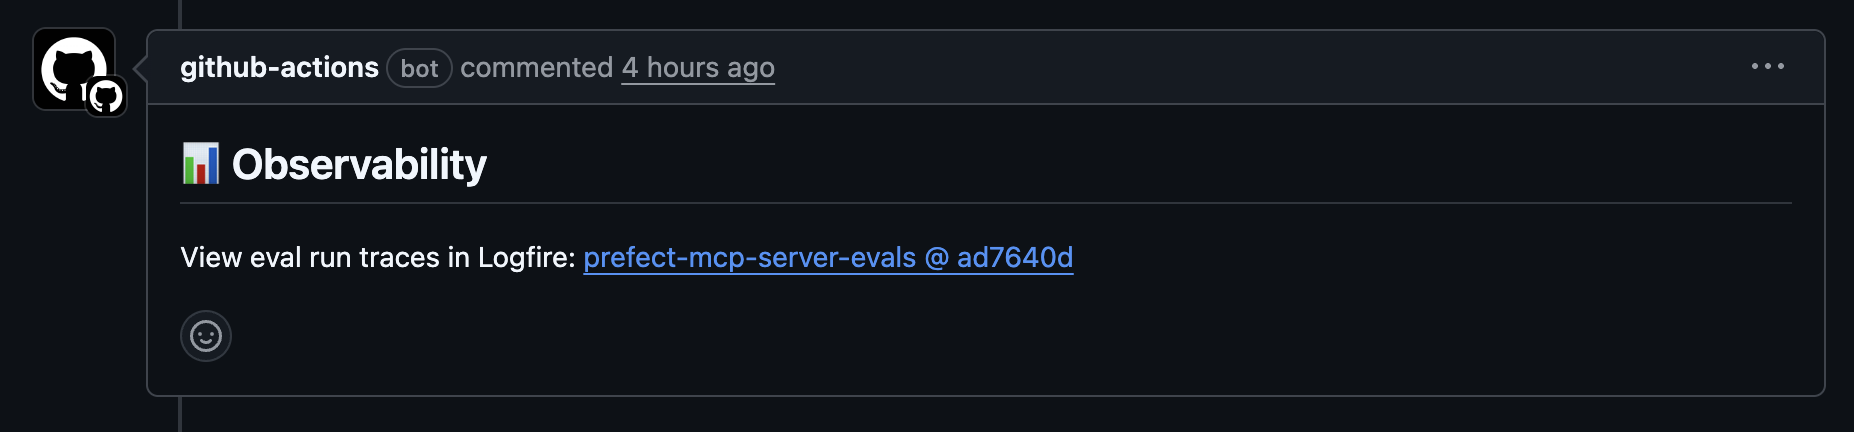
You know you want to click that link
This has sped up the loop a lot. Instead of hours of print-debugging, hunches, and ouija boards, we’re able to iterate quickly with concrete evidence. We still apply taste, but it’s guided by what agents actually do and how many tokens it takes them to do it.
So if you’re building an MCP server (or anything agents touch), I can confidently say that you should invest in observability early. It’ll make the process a whole lot more scrutable.